The shells
In this chapter
- Say what a shell is and why it is made before the data are unblinded.
- Read the shell of the primary table: population, columns, rows, statistics, formats.
- See where each part of a shell comes from in the SAP.
- Time
- 15 minutes
- At the end you have
- the 12 shells of the plan, read as the team reads them before the unblinding.
14.1 The idea: agree on the table before the numbers exist
Section titled “14.1 The idea: agree on the table before the numbers exist”A shell is a table without its numbers: the title, the population, the columns, the rows, the statistics and their
format (xx.x is a mean with one decimal). The clinical team reviews the shells while the study is still blind. Then
nobody can choose a table, a population or a statistic after seeing which one looks best. This is the same reason why
the SAP is final before the blind is broken ICH E9 5.1.
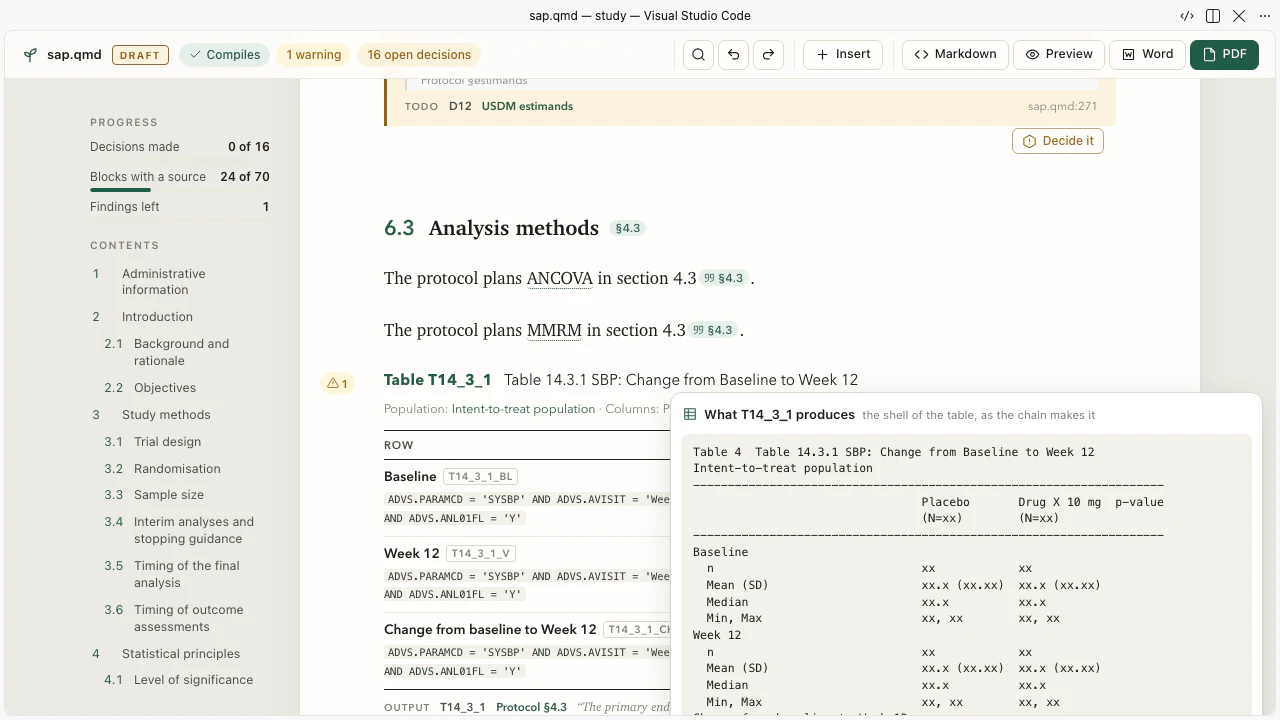
Sapling makes each shell from the table block of the SAP. Change the SAP, and the shell changes with it.
14.2 The shells of the pilot
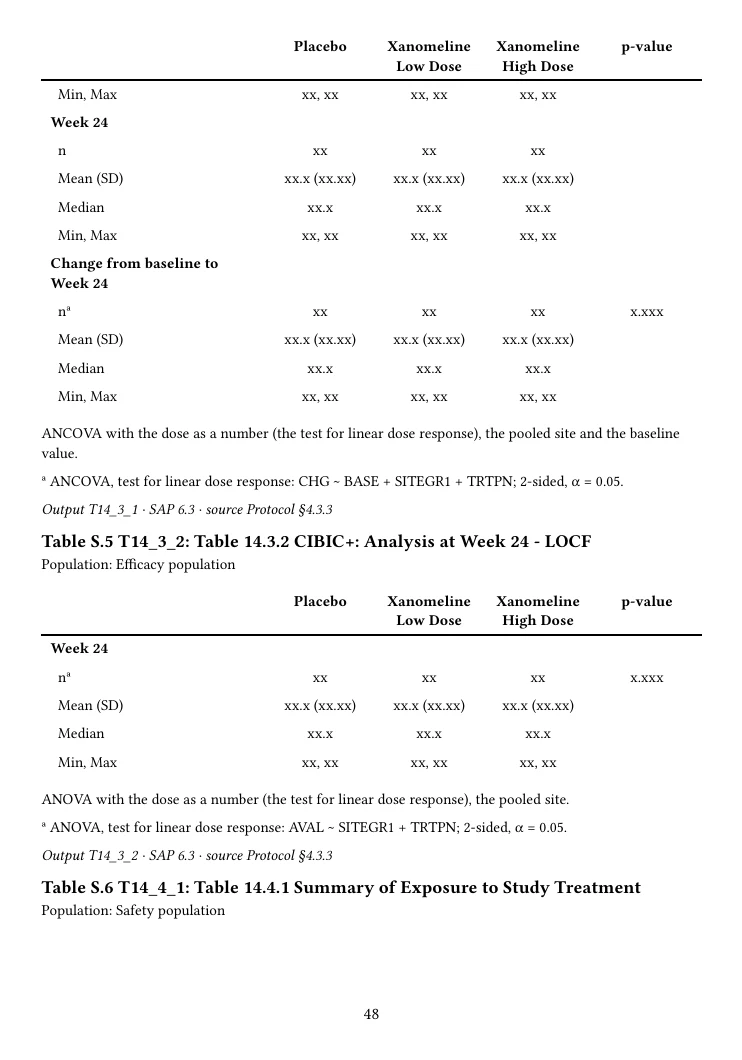
Section titled “14.2 The shells of the pilot”sapling build wrote twelve shells into out/tlf/shells, one per table of the plan: populations, disposition, demographics, the two primary analyses, exposure,
four adverse event tables, two laboratory tables, vital signs.
| Statistic | Placebo (N=xx) | Xanomeline Low Dose (N=xx) | Xanomeline High Dose (N=xx) | p-value |
|---|---|---|---|---|
| Baseline | ||||
| n | xx | xx | xx | |
| Mean (SD) | xx.x (xx.xx) | xx.x (xx.xx) | xx.x (xx.xx) | |
| Median | xx.x | xx.x | xx.x | |
| Min, Max | xx, xx | xx, xx | xx, xx | |
| Week 24 | ||||
| n | xx | xx | xx | |
| Mean (SD) | xx.x (xx.xx) | xx.x (xx.xx) | xx.x (xx.xx) | |
| Median | xx.x | xx.x | xx.x | |
| Min, Max | xx, xx | xx, xx | xx, xx | |
| Change from baseline to Week 24 | ||||
| n | xx | xx | xx | x.xxx |
| Mean (SD) | xx.x (xx.xx) | xx.x (xx.xx) | xx.x (xx.xx) | |
| Median | xx.x | xx.x | xx.x | |
| Min, Max | xx, xx | xx, xx | xx, xx | |
Template: · SAP: 4.3.3 · Output: T14_3_1Source: out/tlf/shells/t14_3_1.txt
Read it from the top:
- The population: the efficacy population (EFF), from the table block.
- The columns: the three planned treatment groups, each with its N. They come from the settings of the plan
(
treatments:), never typed into a program. - The rows: three analyses of the ADAS-Cog (11): the baseline, the value at week 24, the change. Each is a block of the table in the SAP.
- The p-value: one cell,
x.xxx, on the change from baseline. It is the dose response test of the primary estimand. - The last line: the section of the SAP (4.3.3) and the id of the output.
Your turn 14.1 The shell of the second primary endpoint
Open the shell of Table 14.3.2. How is it different from Table 14.3.1, and why?
Show the answer
| Statistic | Placebo (N=xx) | Xanomeline Low Dose (N=xx) | Xanomeline High Dose (N=xx) | p-value |
|---|---|---|---|---|
| Week 24 | ||||
| n | xx | xx | xx | x.xxx |
| Mean (SD) | xx.x (xx.xx) | xx.x (xx.xx) | xx.x (xx.xx) | |
| Median | xx.x | xx.x | xx.x | |
| Min, Max | xx, xx | xx, xx | xx, xx | |
Template: · SAP: 4.3.3 · Output: T14_3_2Source: out/tlf/shells/t14_3_2.txt
It has no baseline row and no change from baseline: only the CIBIC+ at week 24. The CIBIC+ is itself a rating of the change since the start (an impression of change), so the protocol analyses the value, not a change. The test is on the week 24 value.
What you learned
- A shell is a table without numbers, made from the table block of the SAP.
- The team reviews the shells before the unblinding, so that no table is chosen after the results are seen.
- Columns come from the plan’s treatment groups; rows come from the analyses of the table block.
Found an error or have a question? Write to datastep.studio@gmail.com· The plan is written in Sapling; every R program runs in DataStep Studio for R.
Data: the CDISC pilot study (cdiscpilot01). The protocol as CDISC USDM from the CDISC 360i project (MIT licence); the SDTM data from the PhUSE scripts repository (MIT licence). Public example data: no real patient.
R is a project of the R Foundation. SAS is a registered trademark of SAS Institute Inc. CDISC, SDTM, ADaM and USDM are trademarks of the Clinical Data Interchange Standards Consortium. Claude is a trademark of Anthropic. This book is not affiliated with or endorsed by any of them.
© 2026 DataStep Labs. All rights reserved.